Understanding the Dashboard
Quick Tips
- A minimum of 4 weeks of data is required to populate the graphs and the charts.
- Data related to check-in activity will only be available if you have worker check-in/check-out requirements at your locations. If you do not have this requirement, then no data will be displayed.
- The colour on the line charts is used to indicate trend. If the last data point on the chart is greater than (or equal to) the second last data point, the line will be green, indicating an increase (i.e. upward trend). If the last data point is less than the second last data point, the line will be red, indicating a decrease (i.e. downward trend).
- Refresh your page (F5), reload the page, or log out and back in to view the updated information.
Quick Navigation:
Log in > Home
Dashboard
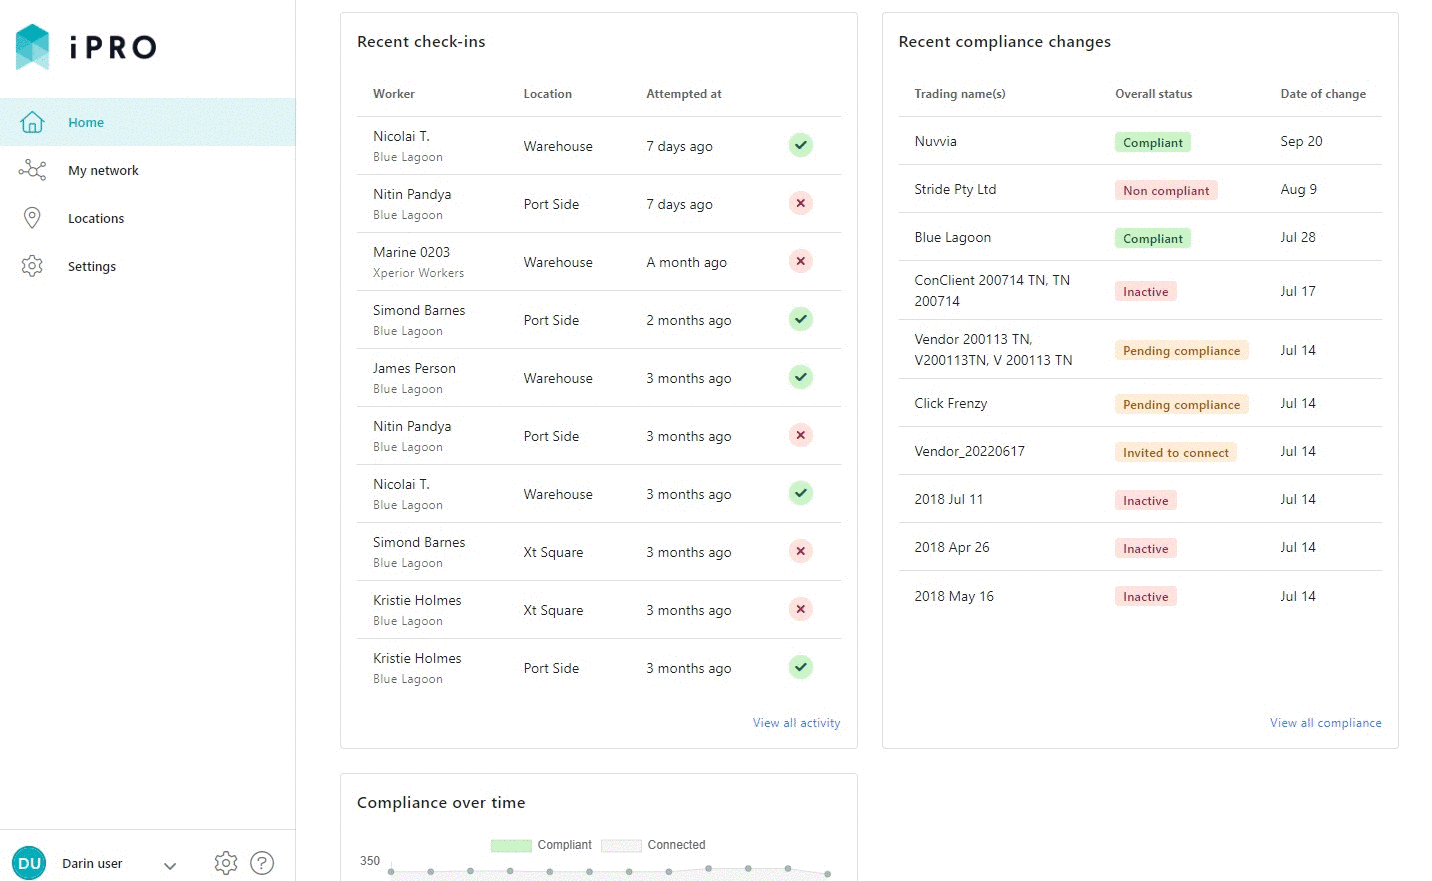
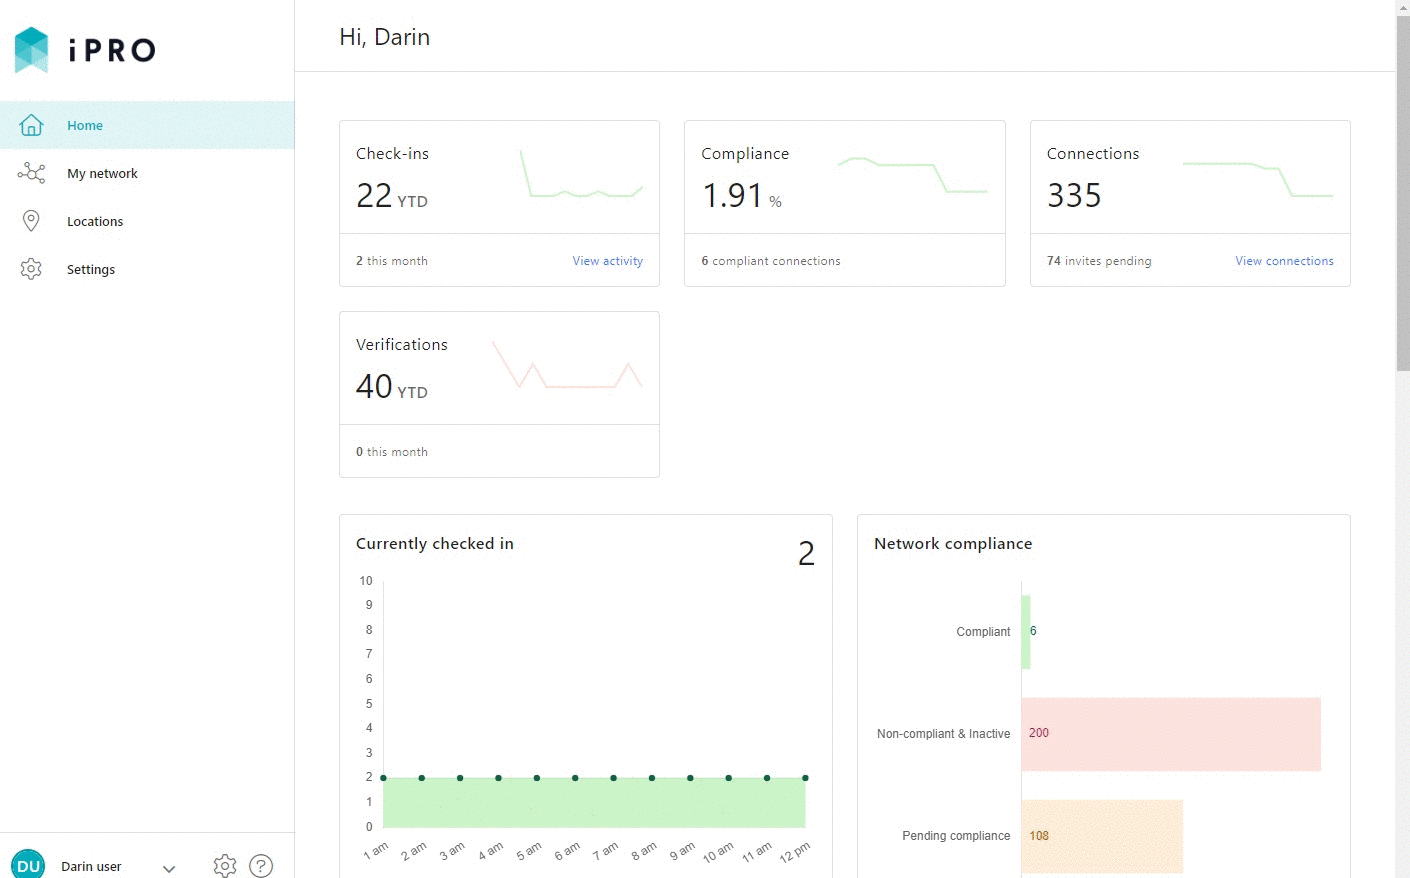
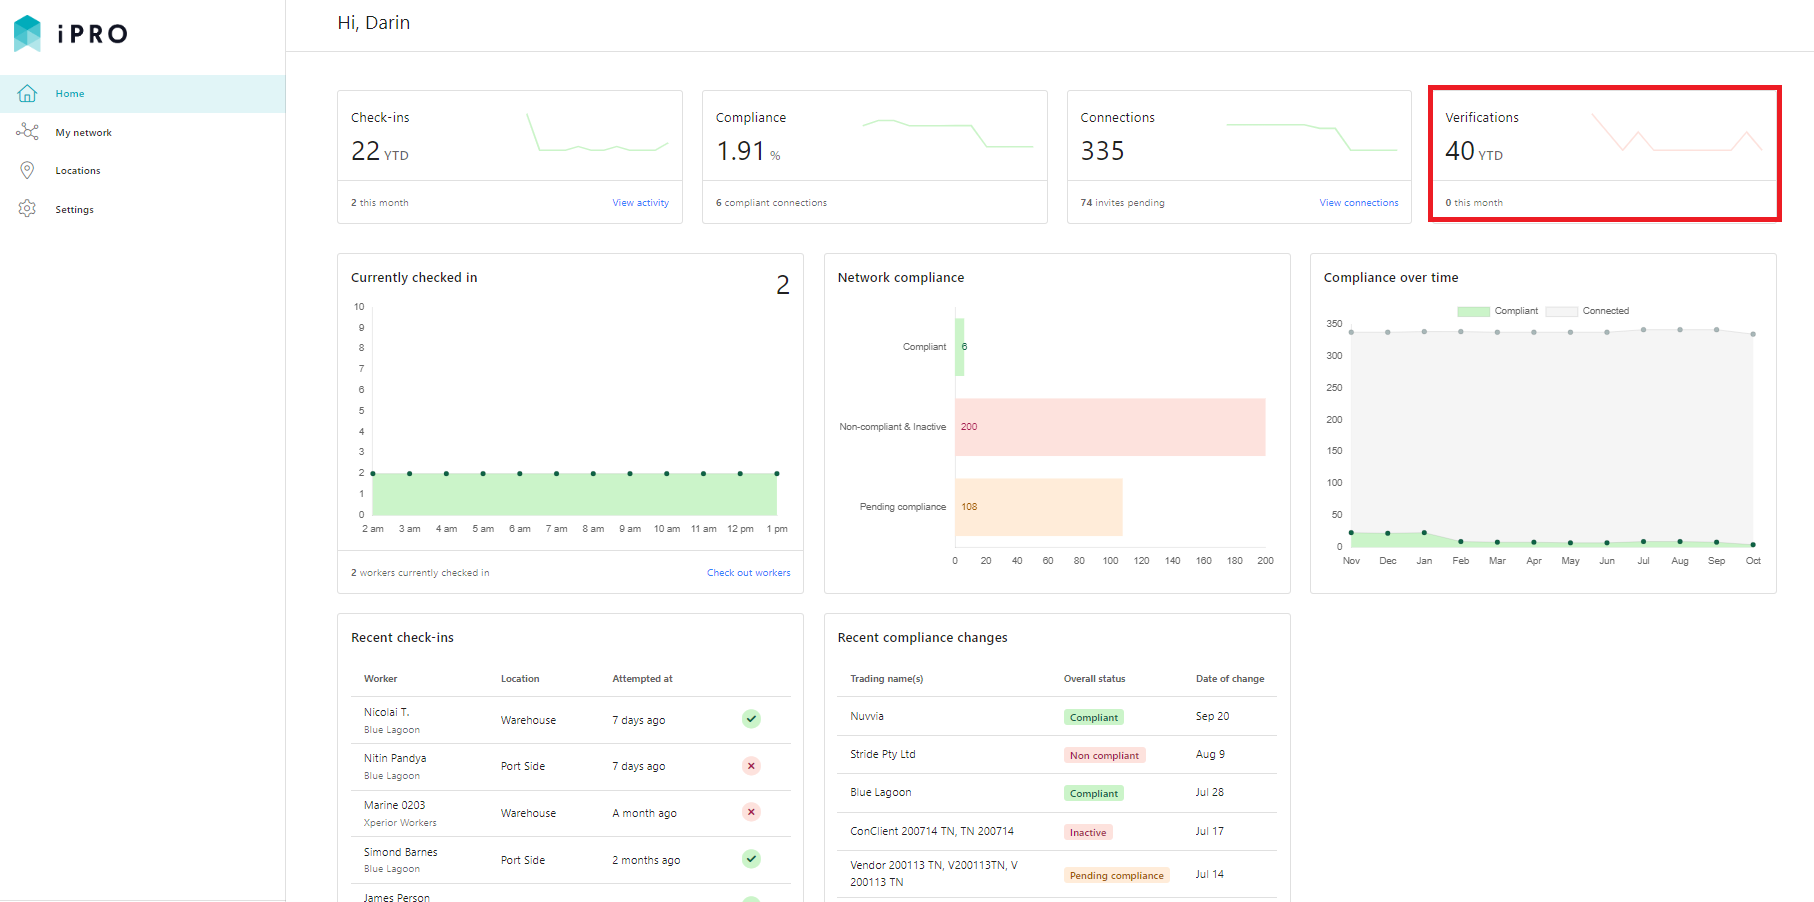
The Dashboard provides an engaging way to quickly see the compliance state of your network, and provides a snapshot of recent onsite worker activity (if applicable). Links are provided to quickly take you to the relevant areas on the platform where you can access more information. The Dashboard will also display the number of document verifications that have been completed this calendar year.
The Dashboard contains a number of charts, tables and metrics for you to get an at a glance overview of your network regarding:
- Network Compliance
- Document Verifications
- Onsite Worker Activity (if applicable)
Click Home on the left hand side navigation menu to view the Dashboard.
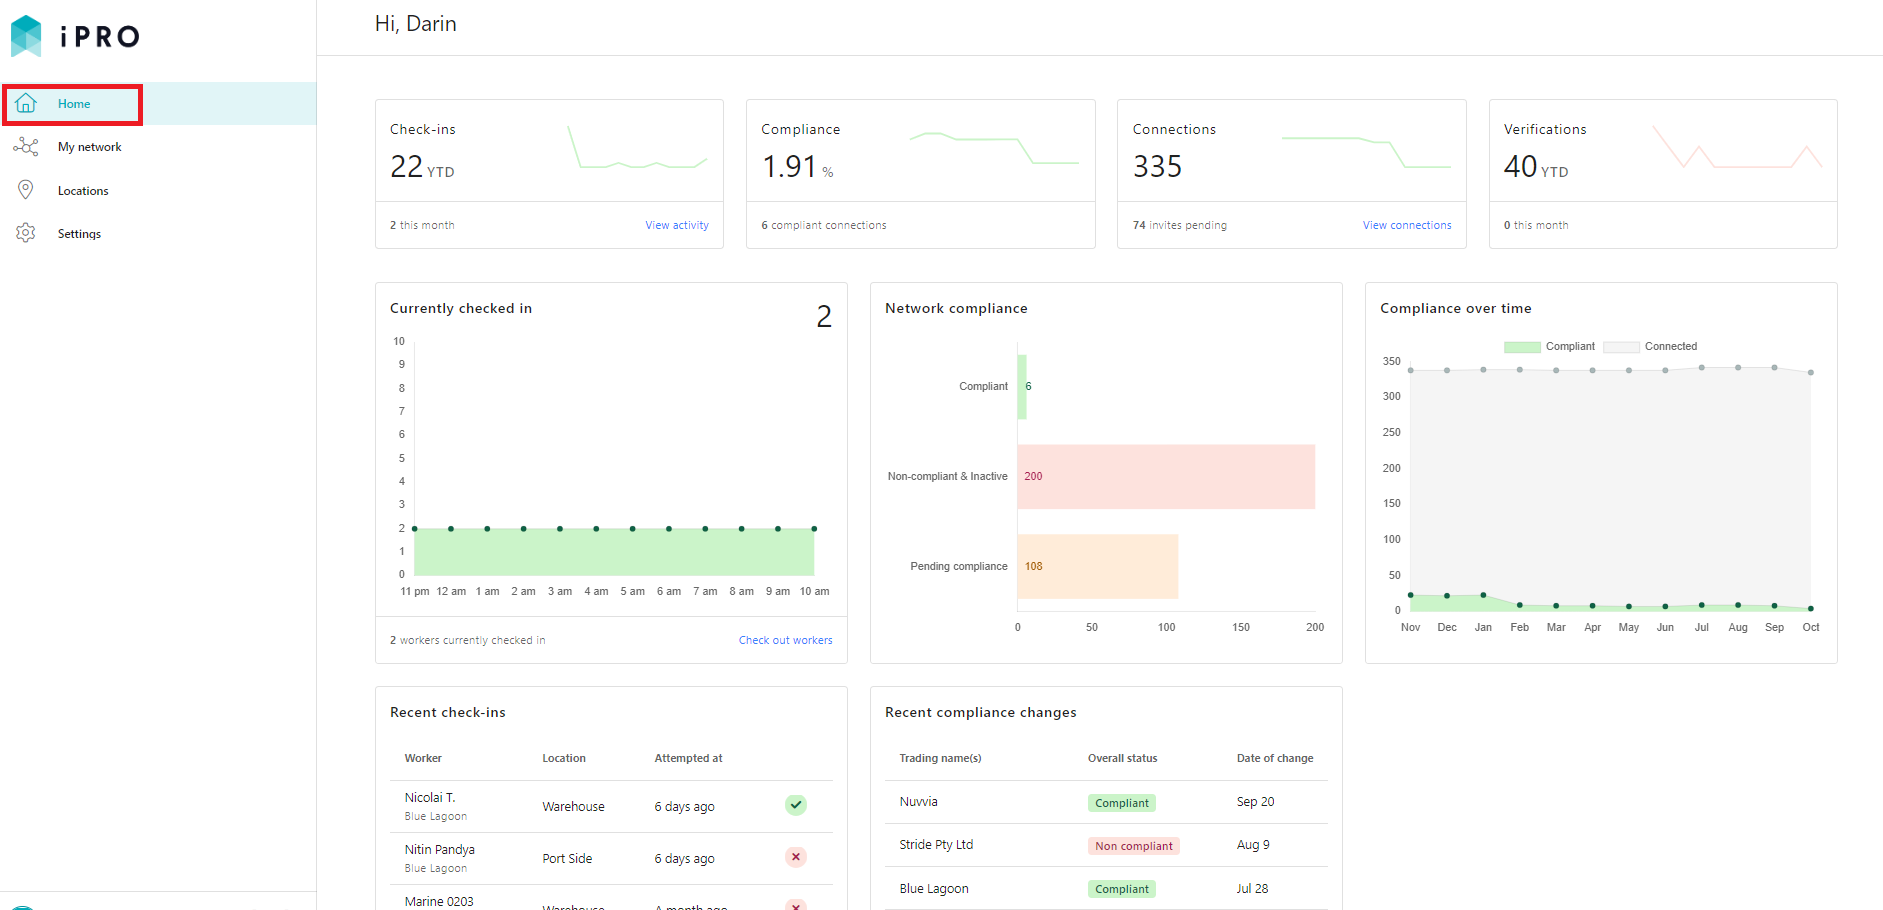
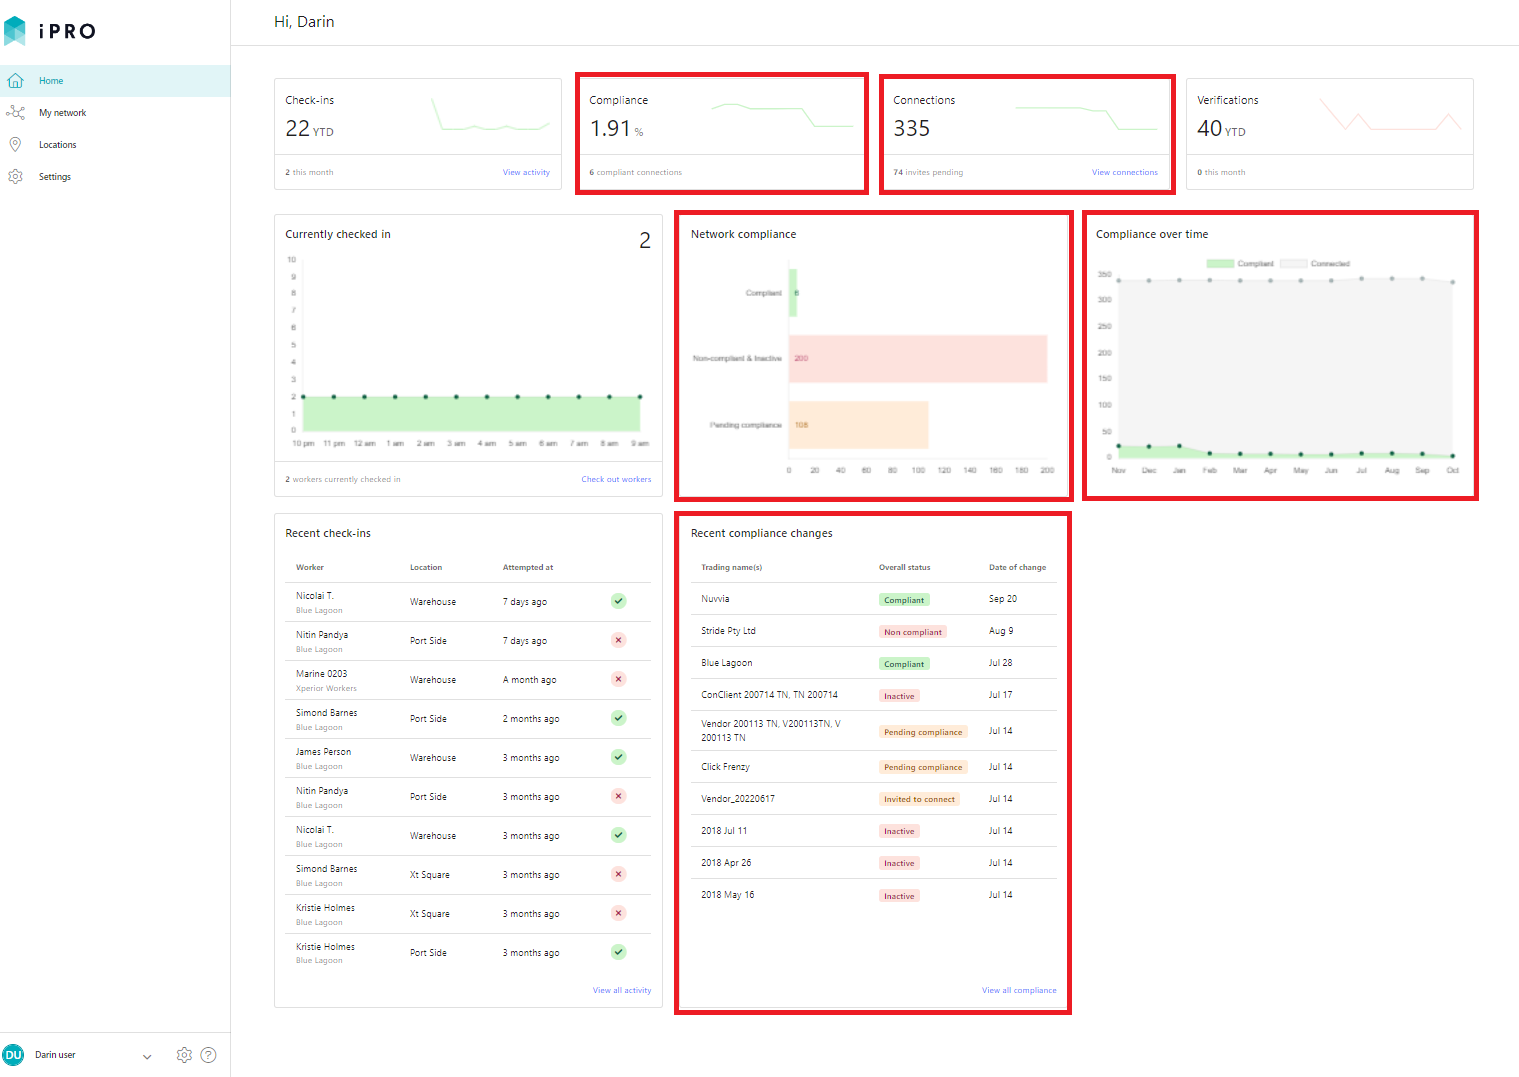
1. Network Compliance
An insight of your network's compliance is revealed by the components: Compliance, Connections, Network compliance, Compliance over time, and Recent compliance changes.
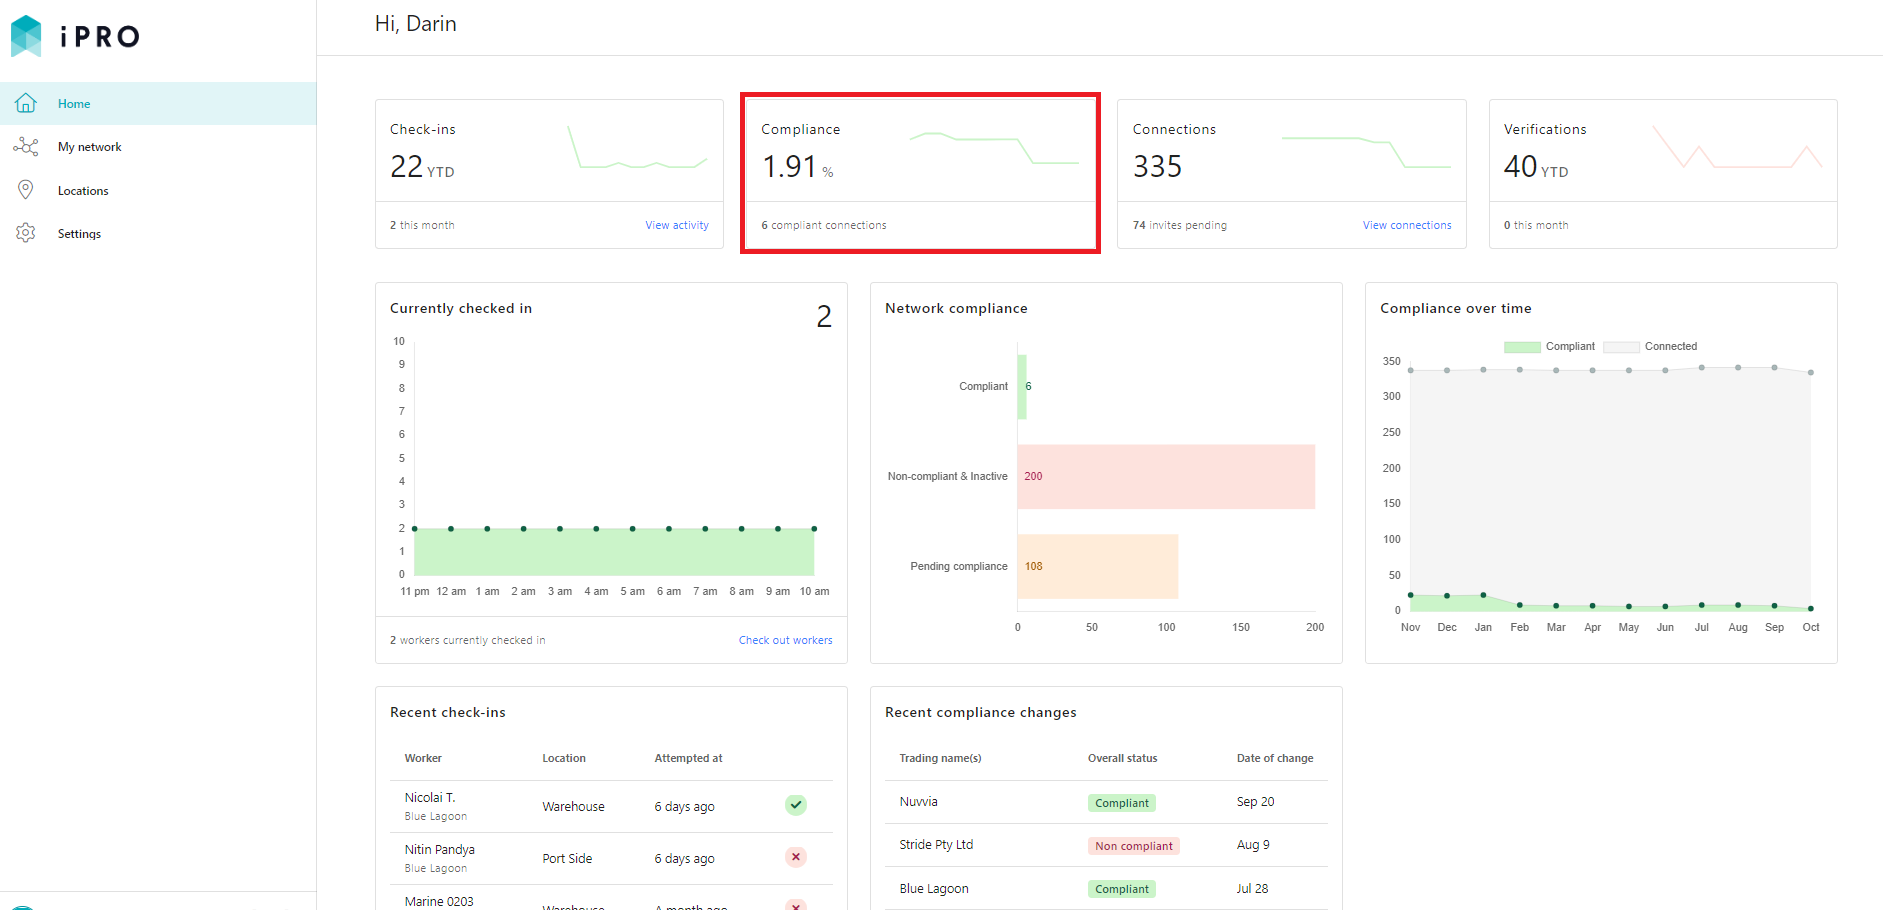
Compliance:
indicates the total number of companies that are connected to the client and are compliant. The chart represents the total of compliant connections that has changed over time.
Connections: is the total number of companies that are connected to your account. It represents the number of companies that have successfully accepted your invitation to connect with them, and have onboarded in iPRO.
- The number of invites pending is the total number of invitations that have been sent to your contracting companies, and are yet to be actioned.
- The chart represents the total number of connections that have changed over time.
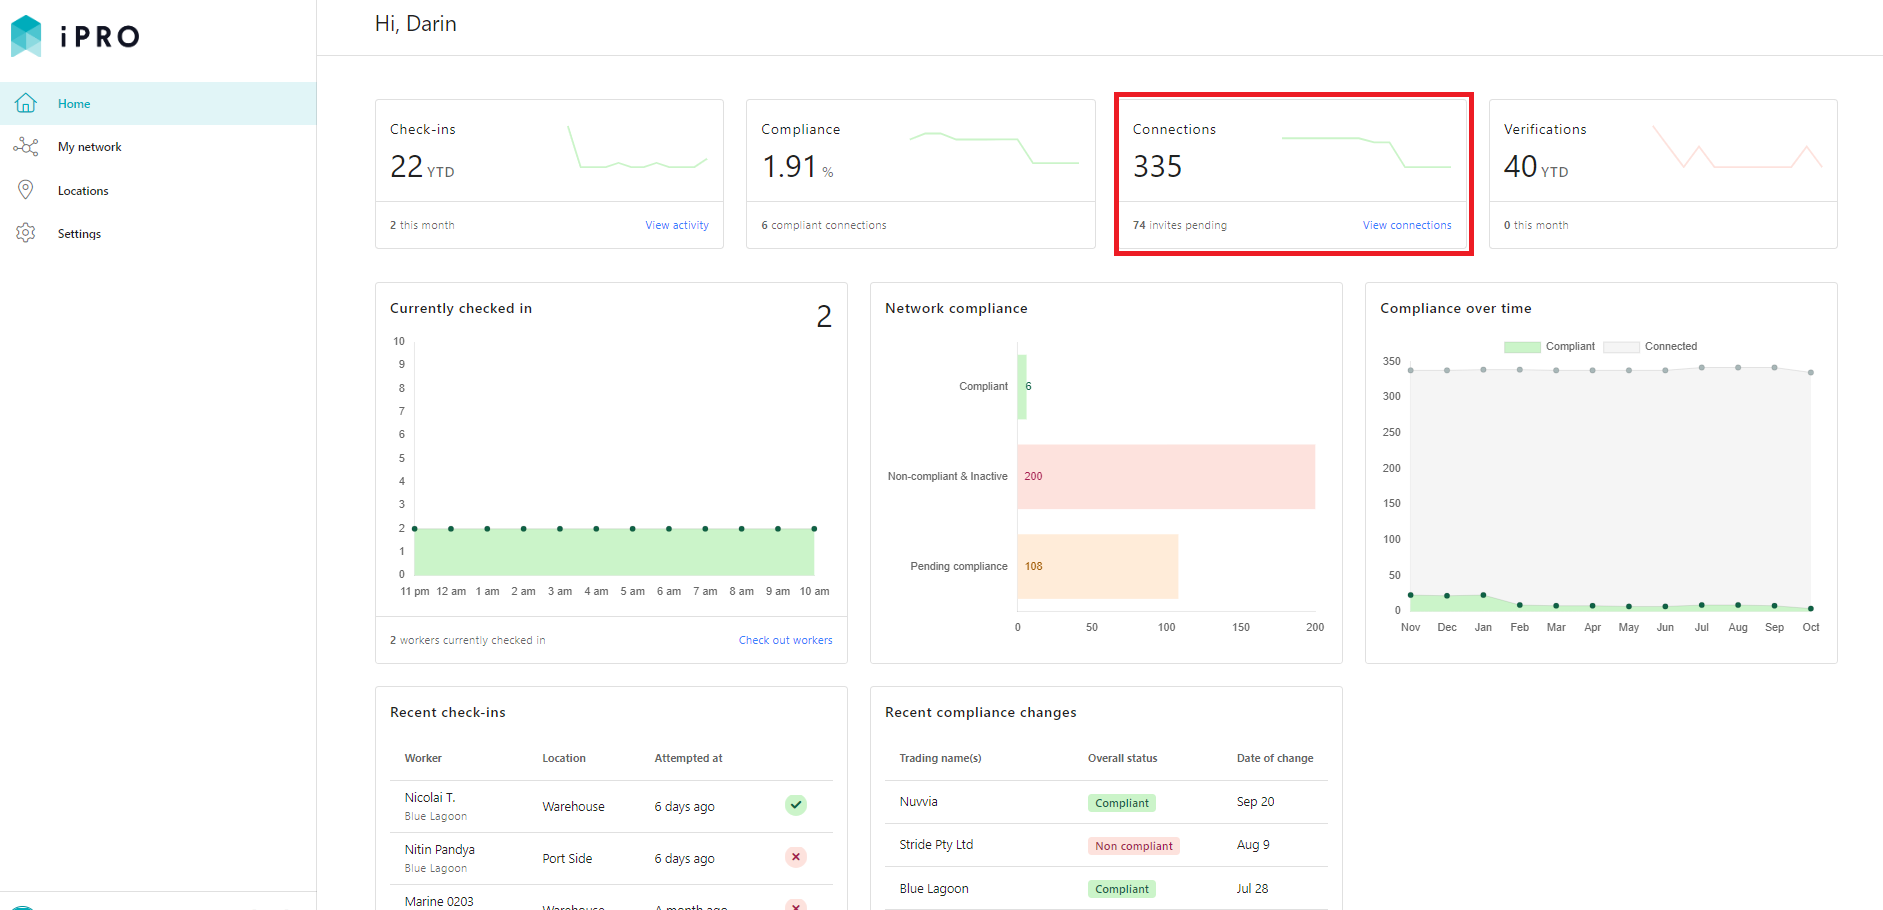
Clicking on the View connections hyperlink will redirect you to My network > All companies, where a list of all your connections, along with their compliance status, is displayed.
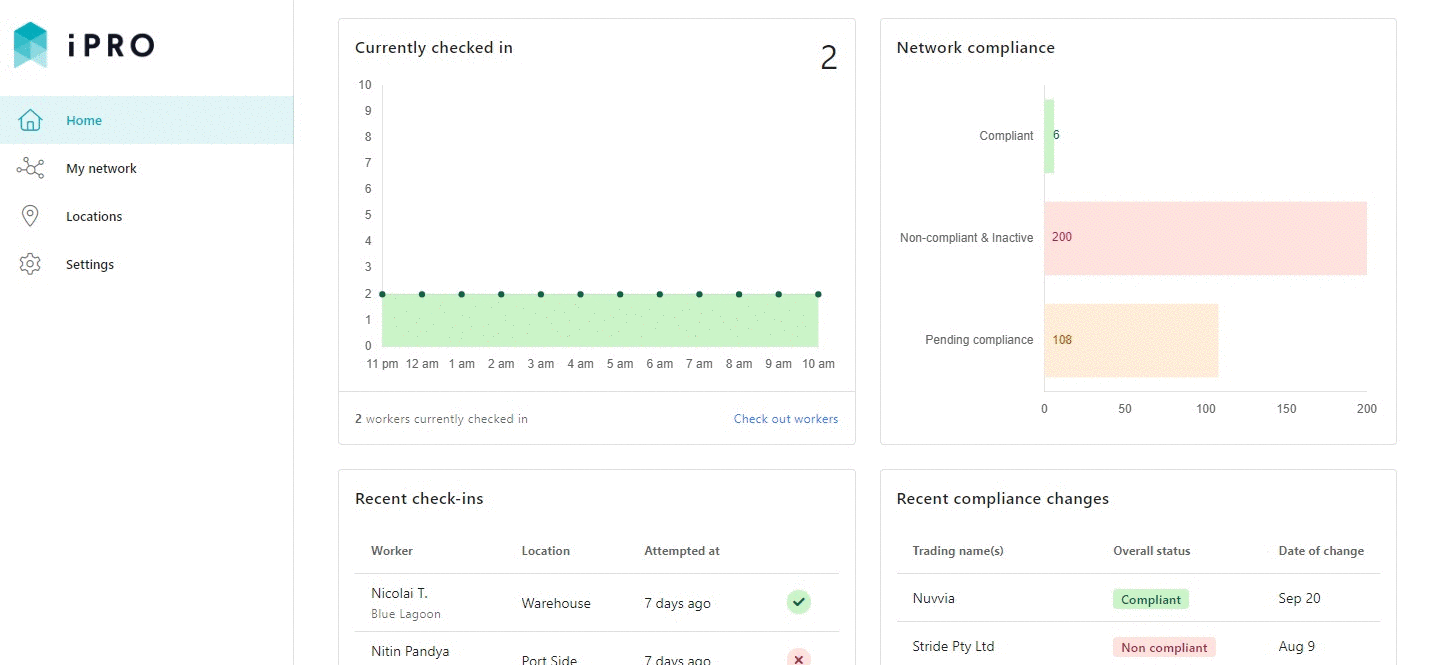
Network Compliance:
provides a break down of the compliance status of all companies within your network that are either Compliant, Non-compliant, Inactive or Pending compliance.
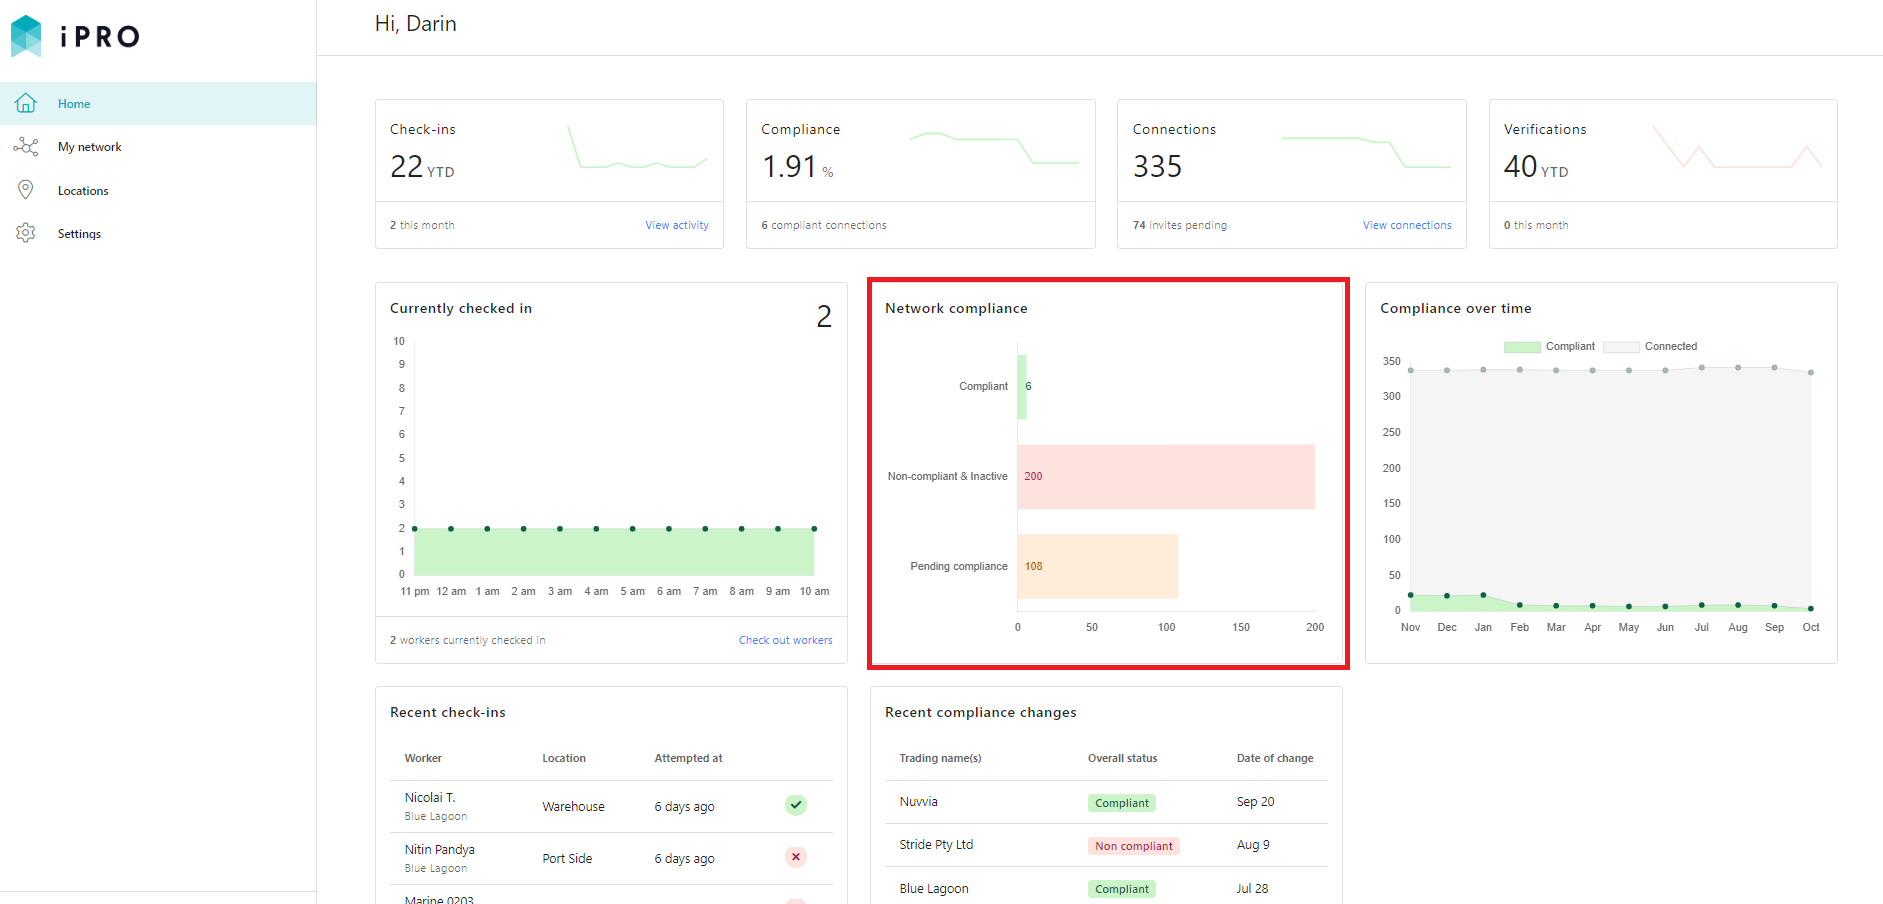
Hovering the mouse over each bar will display the percentage and the number of companies with that particular compliance status. Clicking on each bar will redirect you to My network > All companies, where a list of companies with that particular compliance status will be displayed.
Compliance over time:
indicates the number of companies connected with your account, that have become compliant over a period of time.
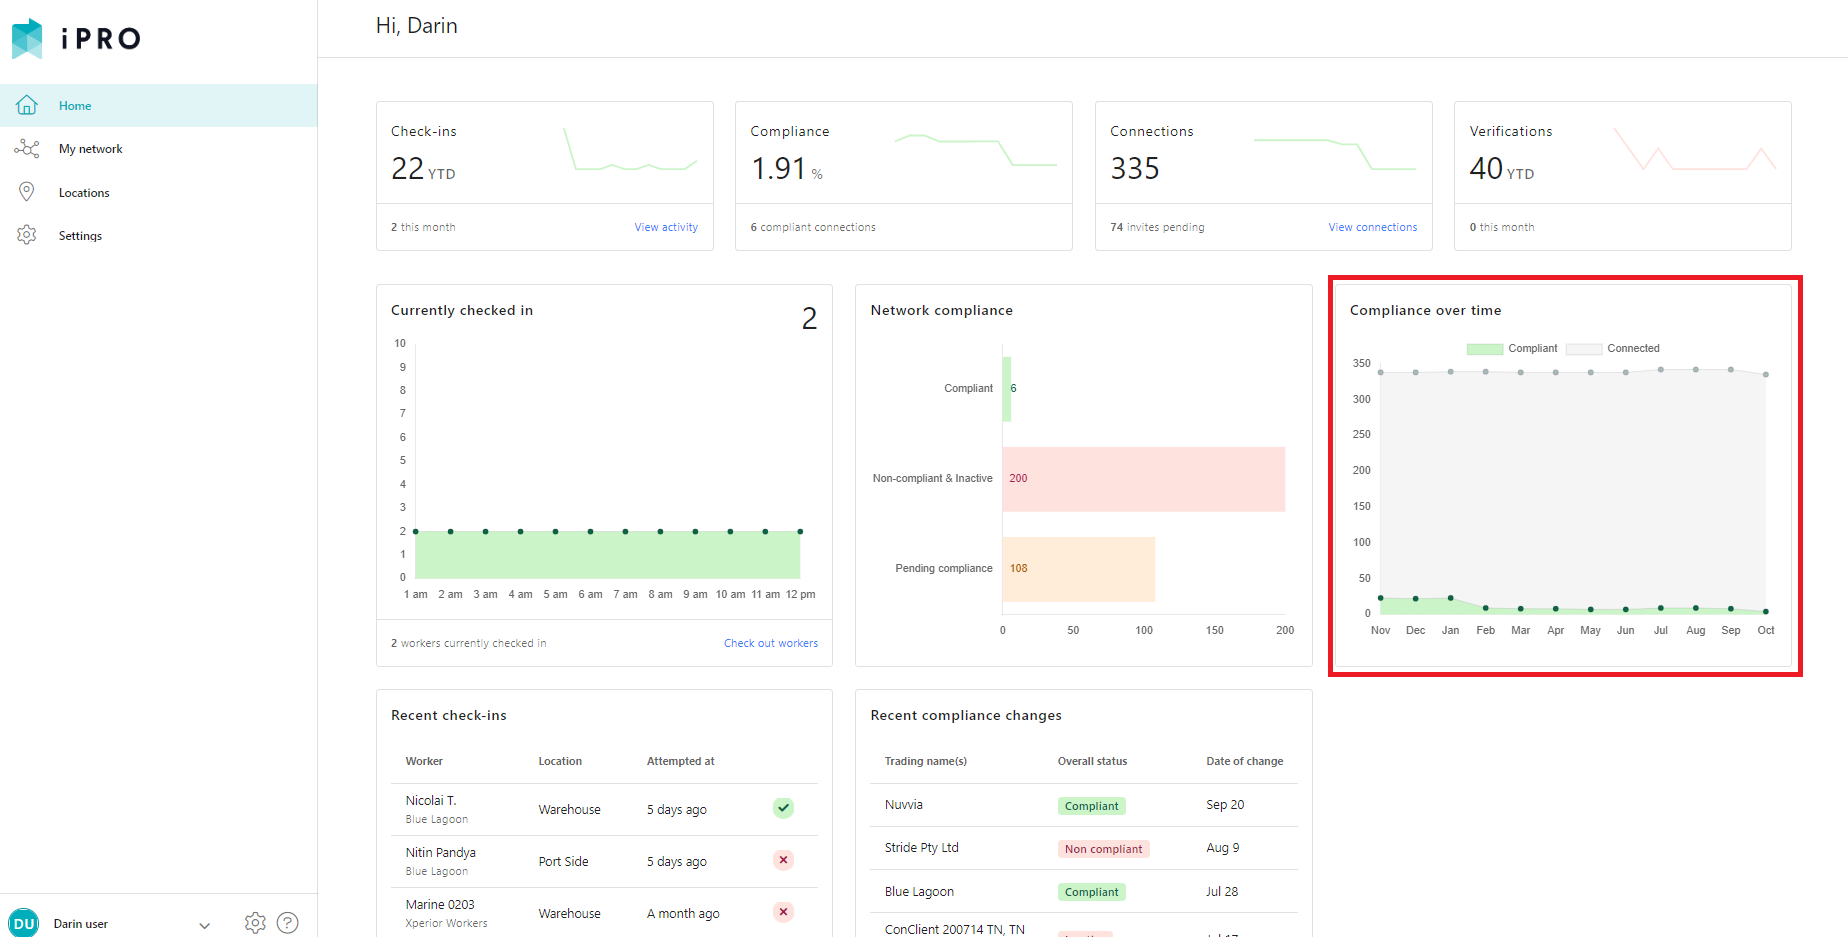
Hovering the mouse along the data points will display the number of companies that were connected and the number of companies that were compliant in a particular month.

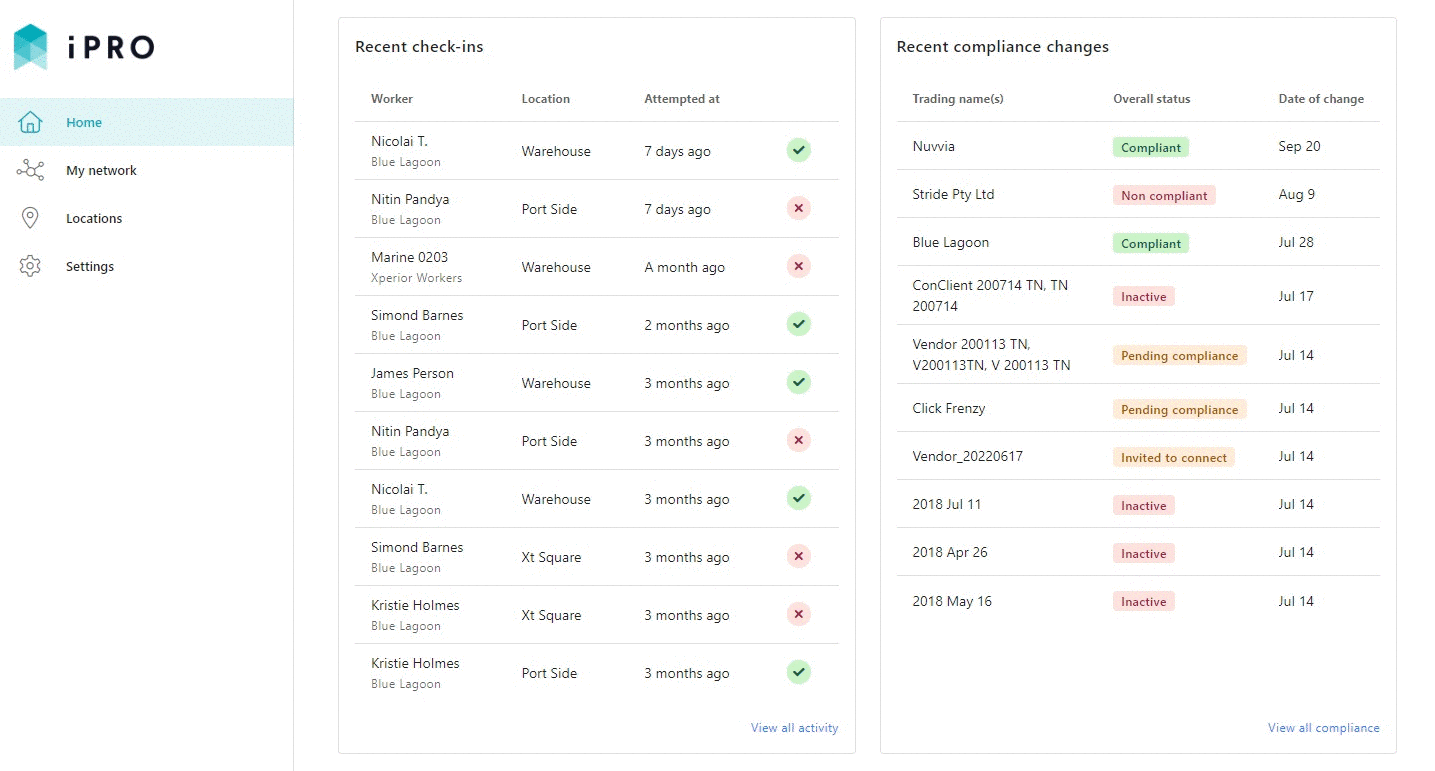
Recent compliance changes:
lists the 10 connections within your network whose compliance status was updated most recently.
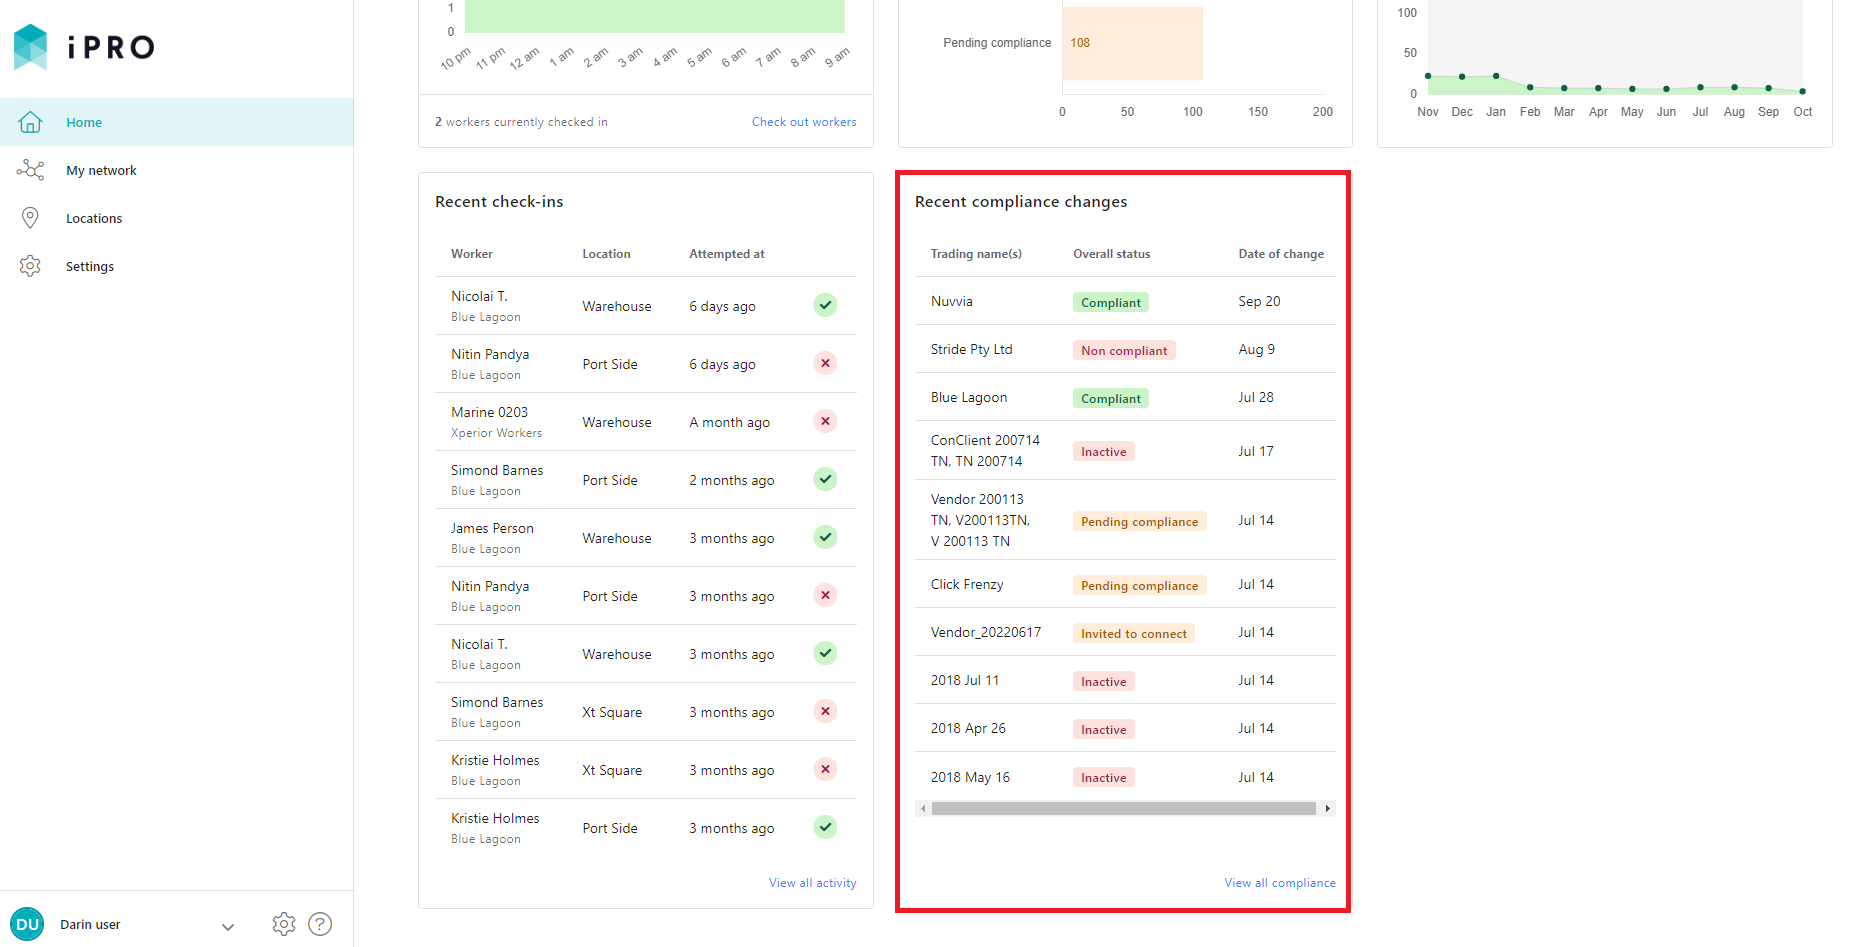
Clicking on the View all compliance hyperlink will redirect you to My network > All companies, where a list of all your connections with their respective compliance status is displayed.
2. Document Verifications
The Dashboard provides an insight of the total number of document verifications that have been completed in the current calendar year, along with the number of verifications that have been completed in the current calendar month. The count includes the verification of the contracting company documents that have been uploaded (based on their assessment response), along with the verification of the worker's credentials that have been uploaded as part of their worker compliance requirements.
Note: Documents and Credentials marked 'Verified', as well as those marked 'Not Accepted' are included in the count.
3. Onsite Worker Activity
The Dashboard provides a snapshot of recent onsite worker activity, and will be available to those clients that have worker compliance and check-in/check-out requirements at their locations.
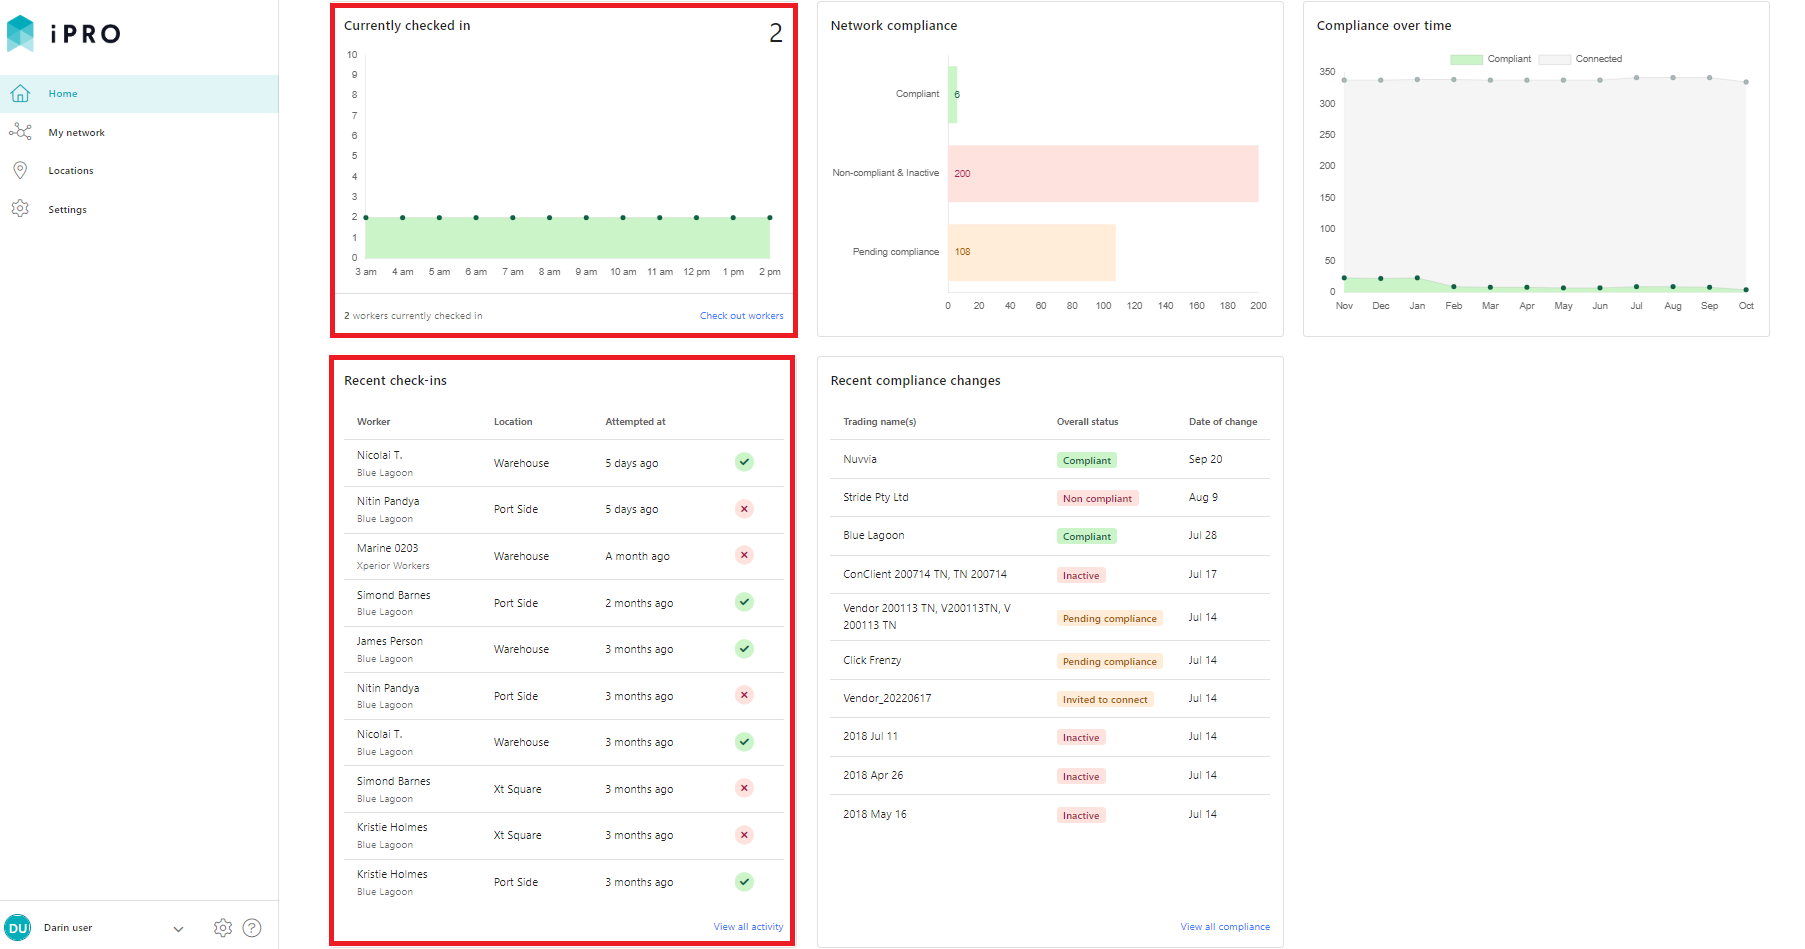
Currently checked in:
displays the total number of workers that are currently checked-in across all locations on the present day. Hovering the mouse along the data points will display the check-in data for each hour.
Clicking on the Check out workers hyperlink will redirect you to a list of all the workers that are currently checked-in. You can manually check out the workers, either individually, or in bulk.
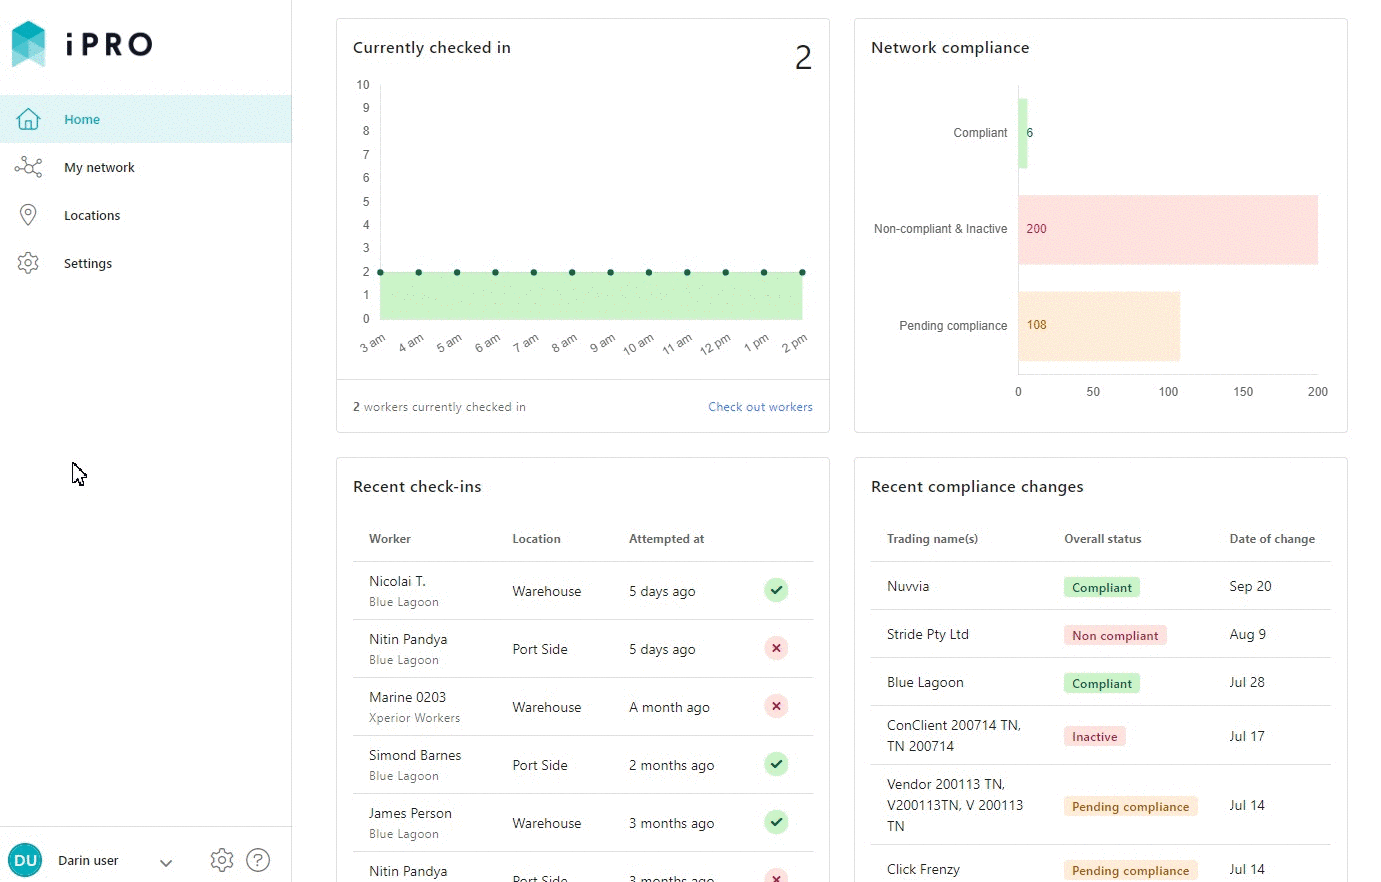
Recent check-ins:
lists the 10 most recent worker check-ins across all of the client's locations. The tick icon indicates that the worker was compliant upon check-in. The cross icon indicates that the worker was non-compliant upon check-in. Clicking the individual's activity record will redirect you to the activity details page, where all the information regarding their access status, compliance status, worker details, and the company's details is displayed.
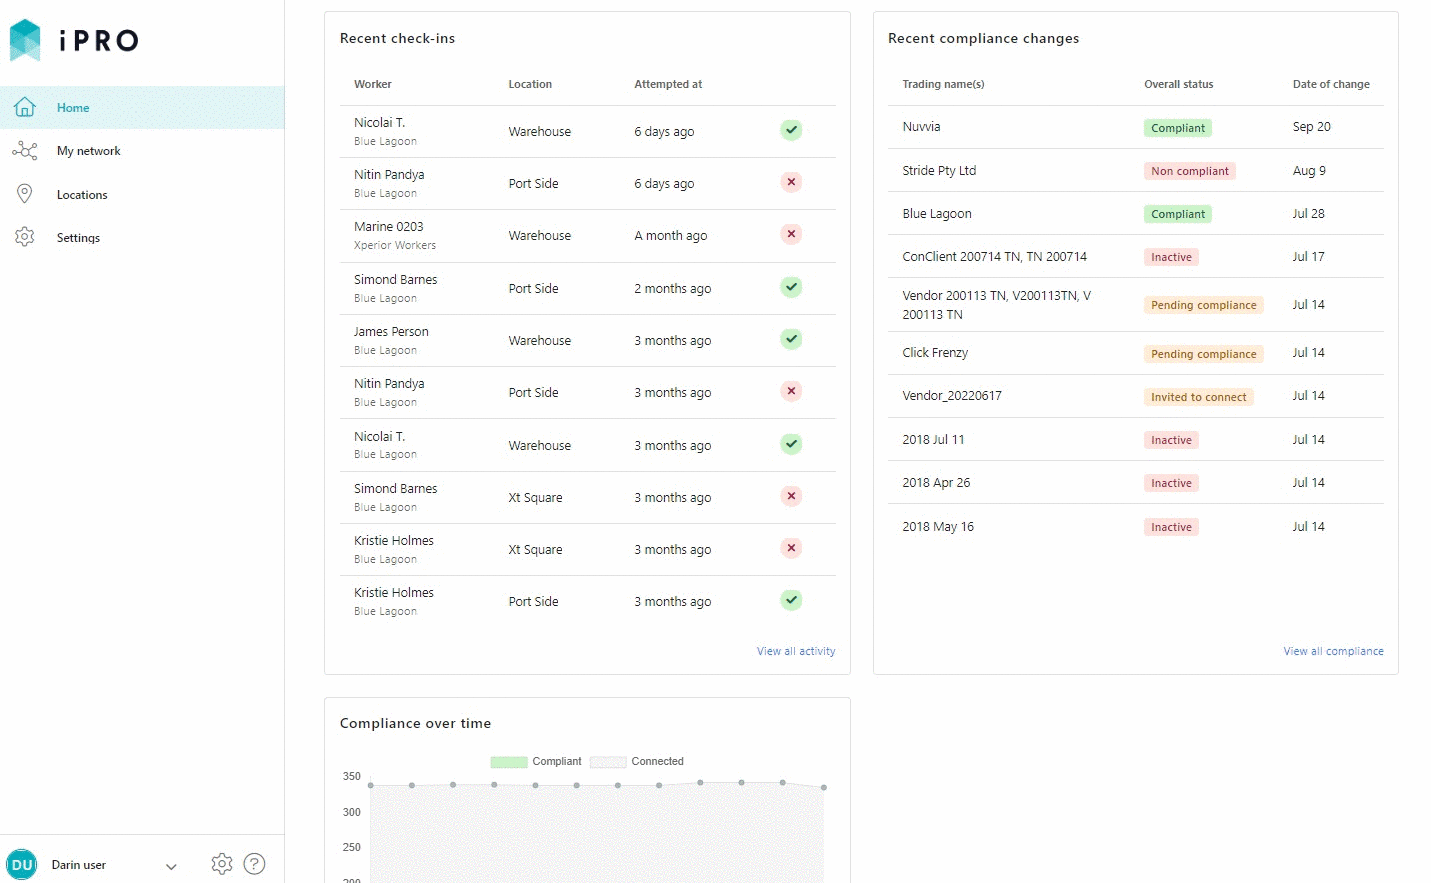
Clicking on the View all activity hyperlink will redirect you to Locations > Activity, where a list of all worker check-in/-check-out activity is displayed.